Writing Task 1
Academic Writing Task 1
You should spend about 20 minutes on this task.
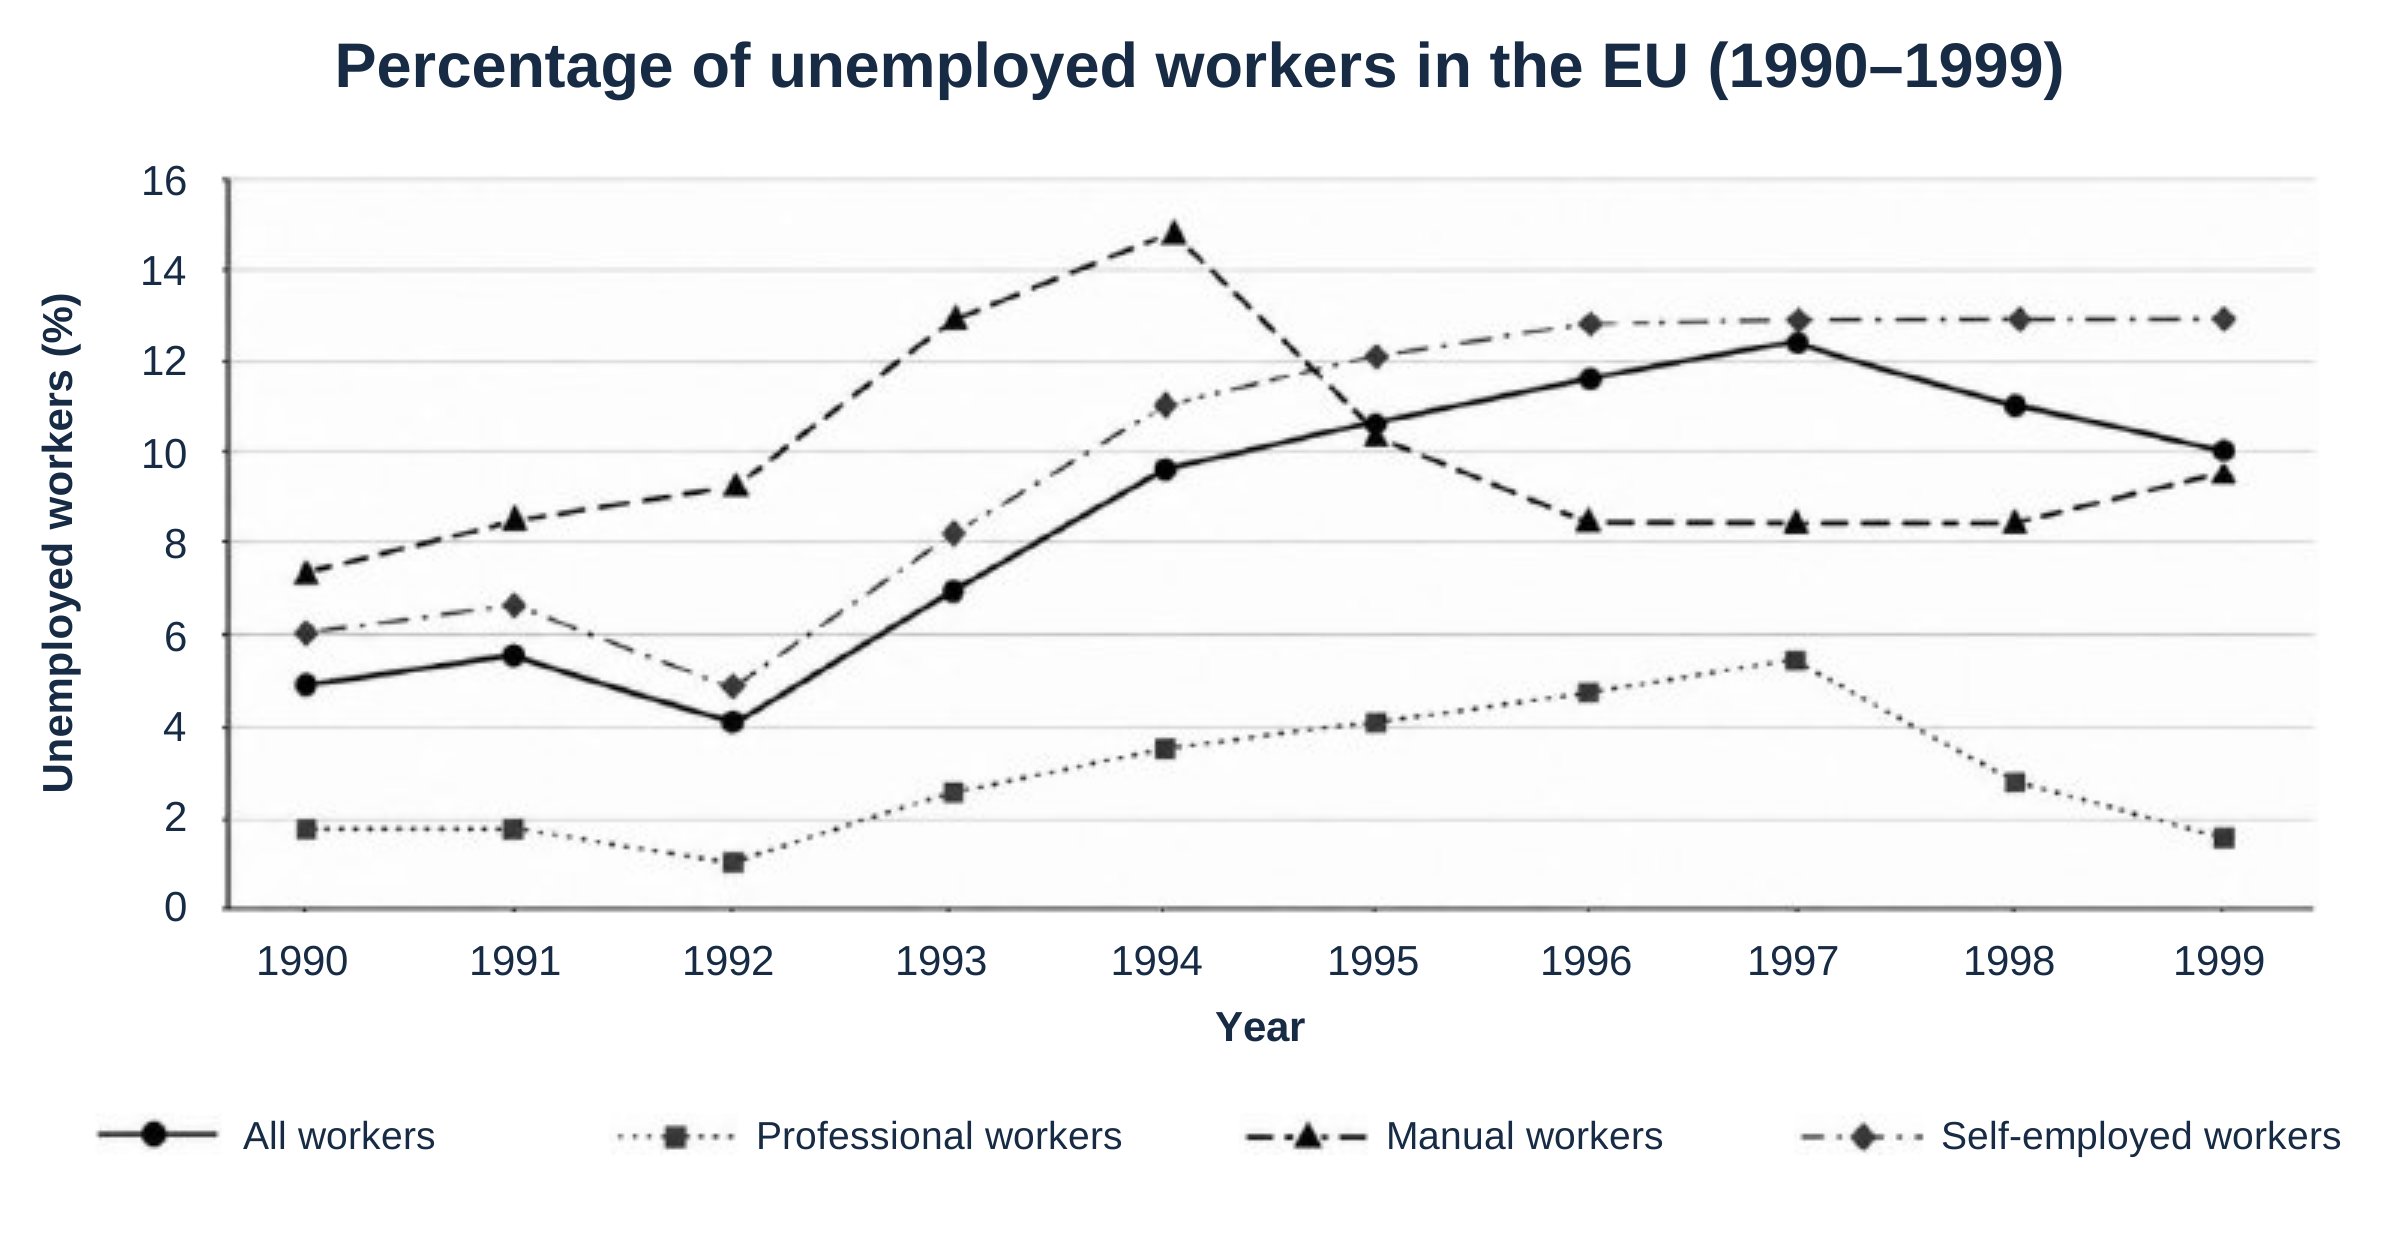
The graph below compares the percentage of unemployed workers in the European Union (all workers) with the percentages in three categories: professionals, manual workers and self-employed workers.
Summarise the information by selecting and reporting the main features, and make comparisons where relevant.
Write at least 150 words.
Writing Task 2
Academic Writing Task 2
You should spend about 40 minutes on this task.
In today’s world of advanced science and technology, we still greatly value our artists, such as musicians, painters and writers.
What can art tell us about life that science and technology cannot?
Give reasons for your answer and include any relevant examples from your own knowledge or experience.
Write at least 250 words.