Writing Task 1
Academic Writing Task 1
You should spend about 20 minutes on this task.
The graph below shows the percentage of households with different kinds of technology in the UK from 1997 to 2001.
Summarise the information by selecting and reporting the main features, and make comparisons where relevant.
Write at least 150 words.
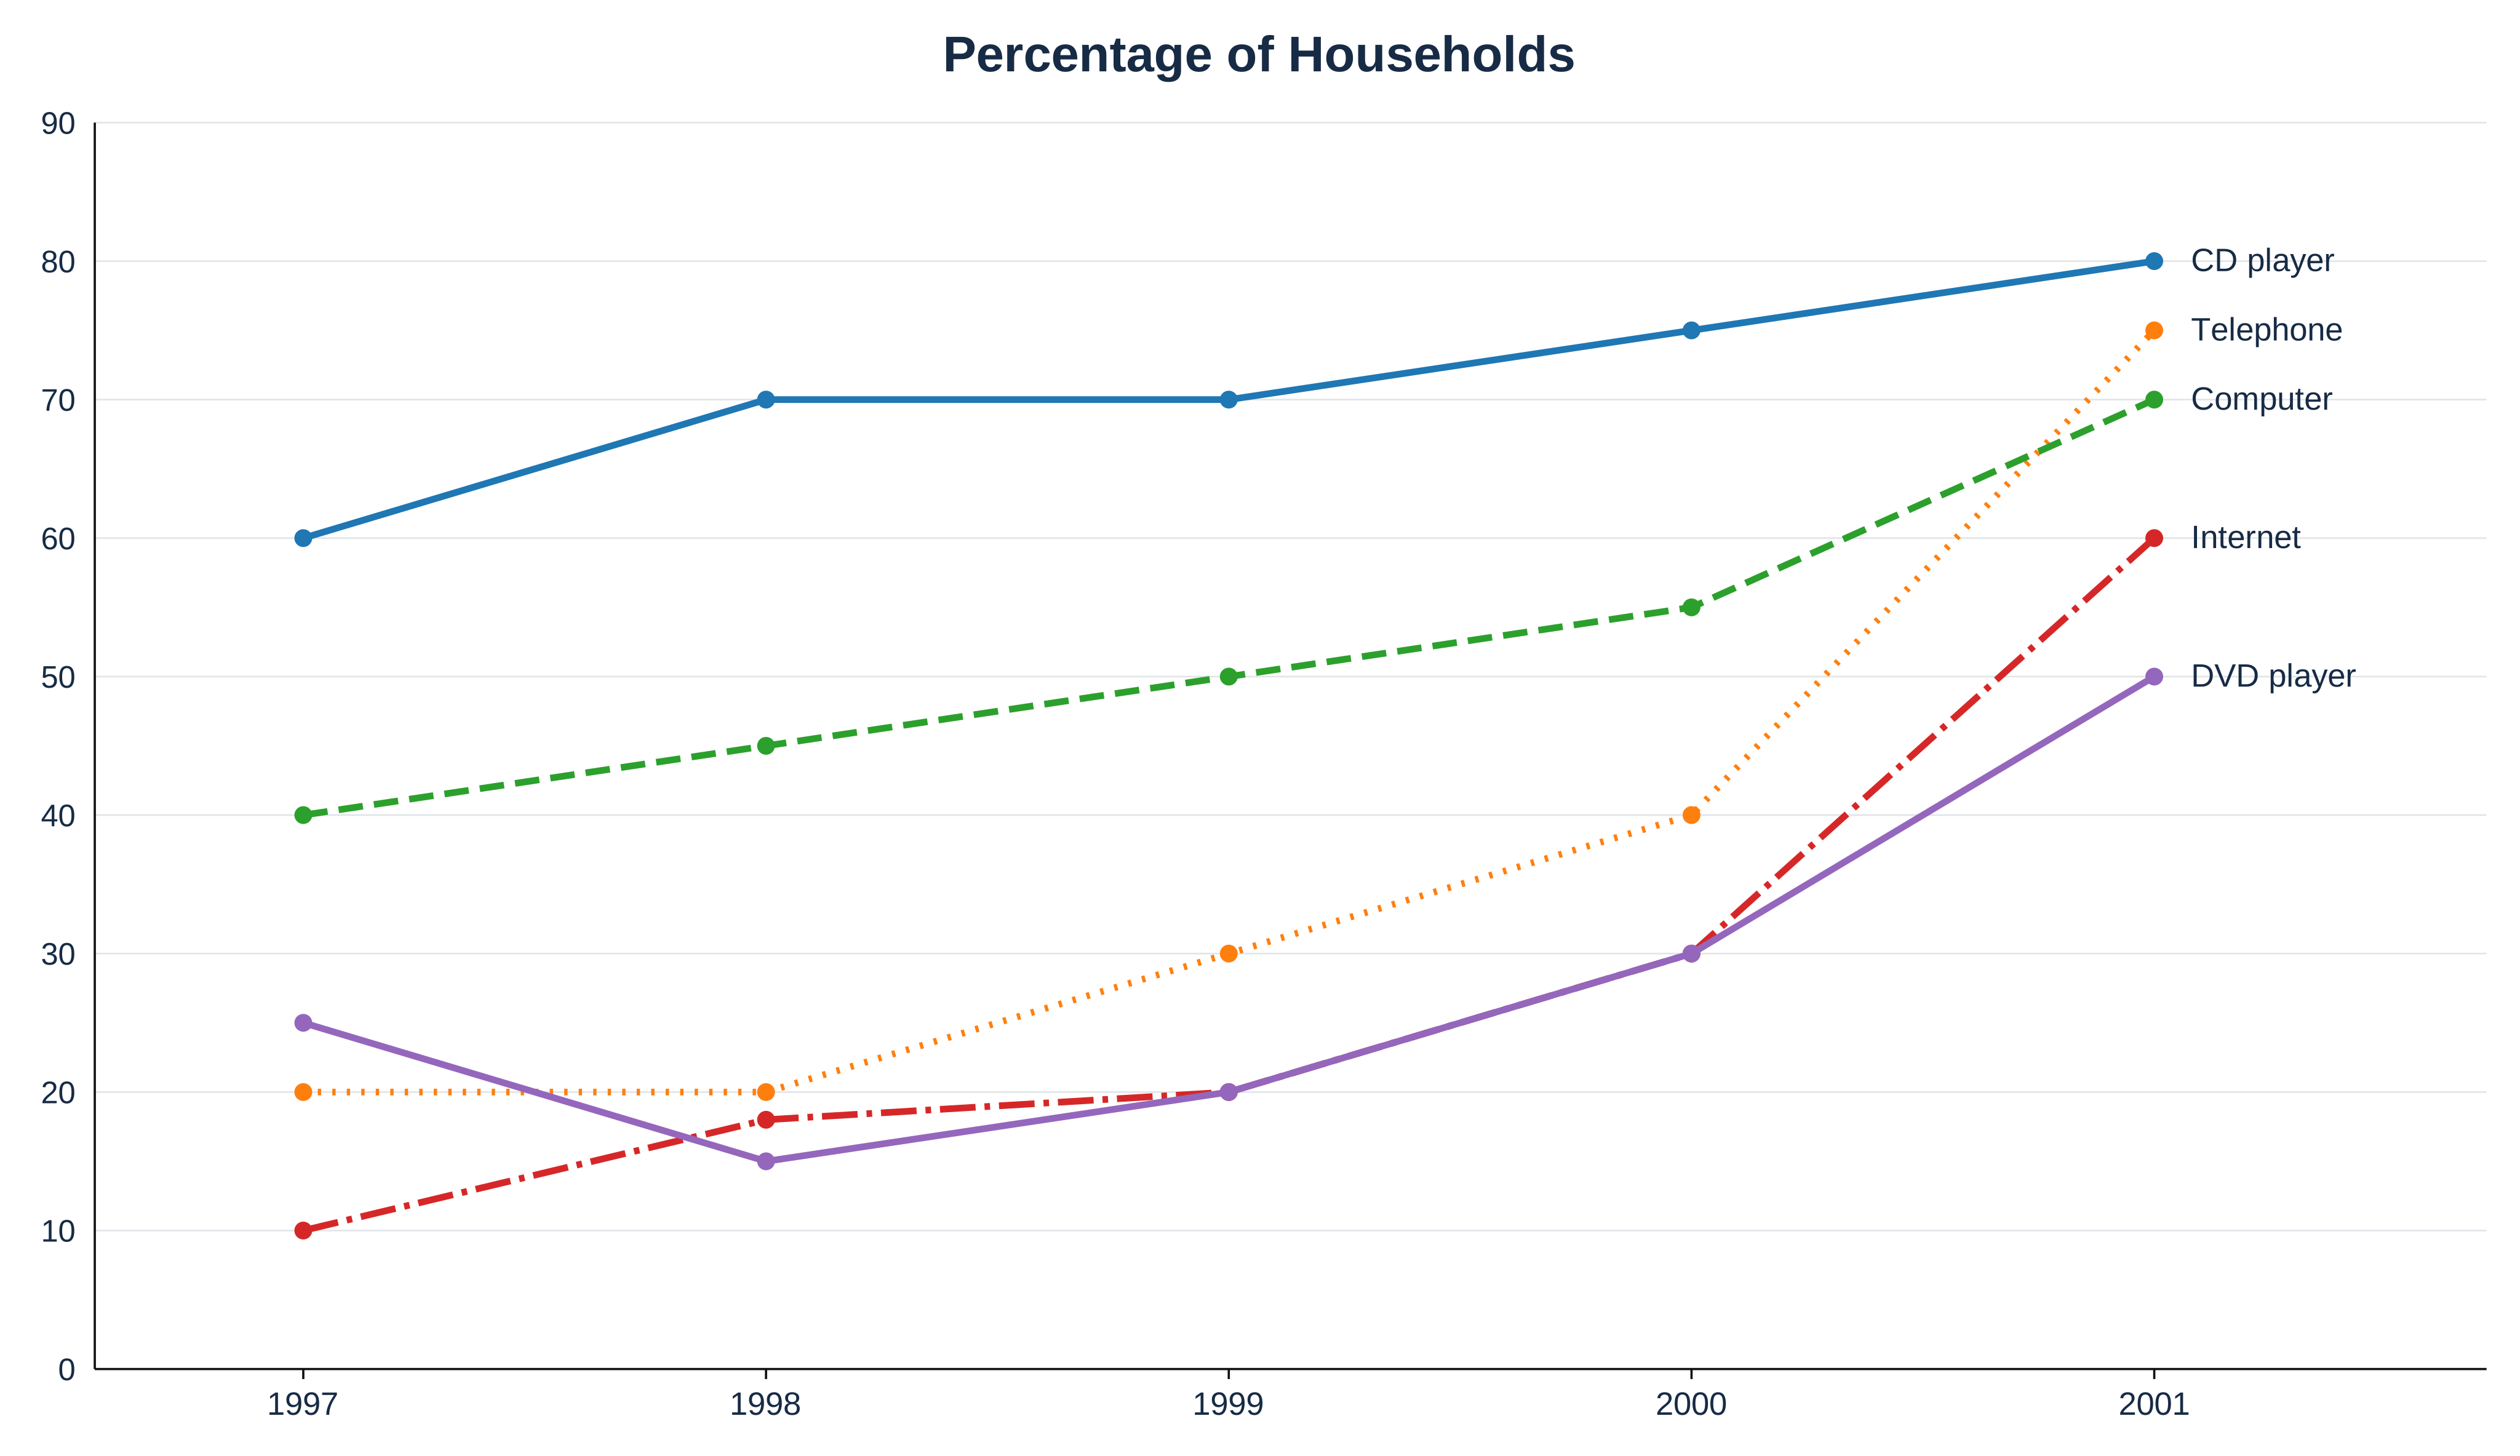
Click the graph to enlarge
Writing Task 2
Academic Writing Task 2
You should spend about 40 minutes on this task.
The best way to improve road safety is to introduce stricter punishments for driving offences.
To what extent do you agree or disagree?
Write at least 250 words.
Your answer — Task 1
0 words