Writing Task 1
Academic Writing Task 1
You should spend about 20 minutes on this task.
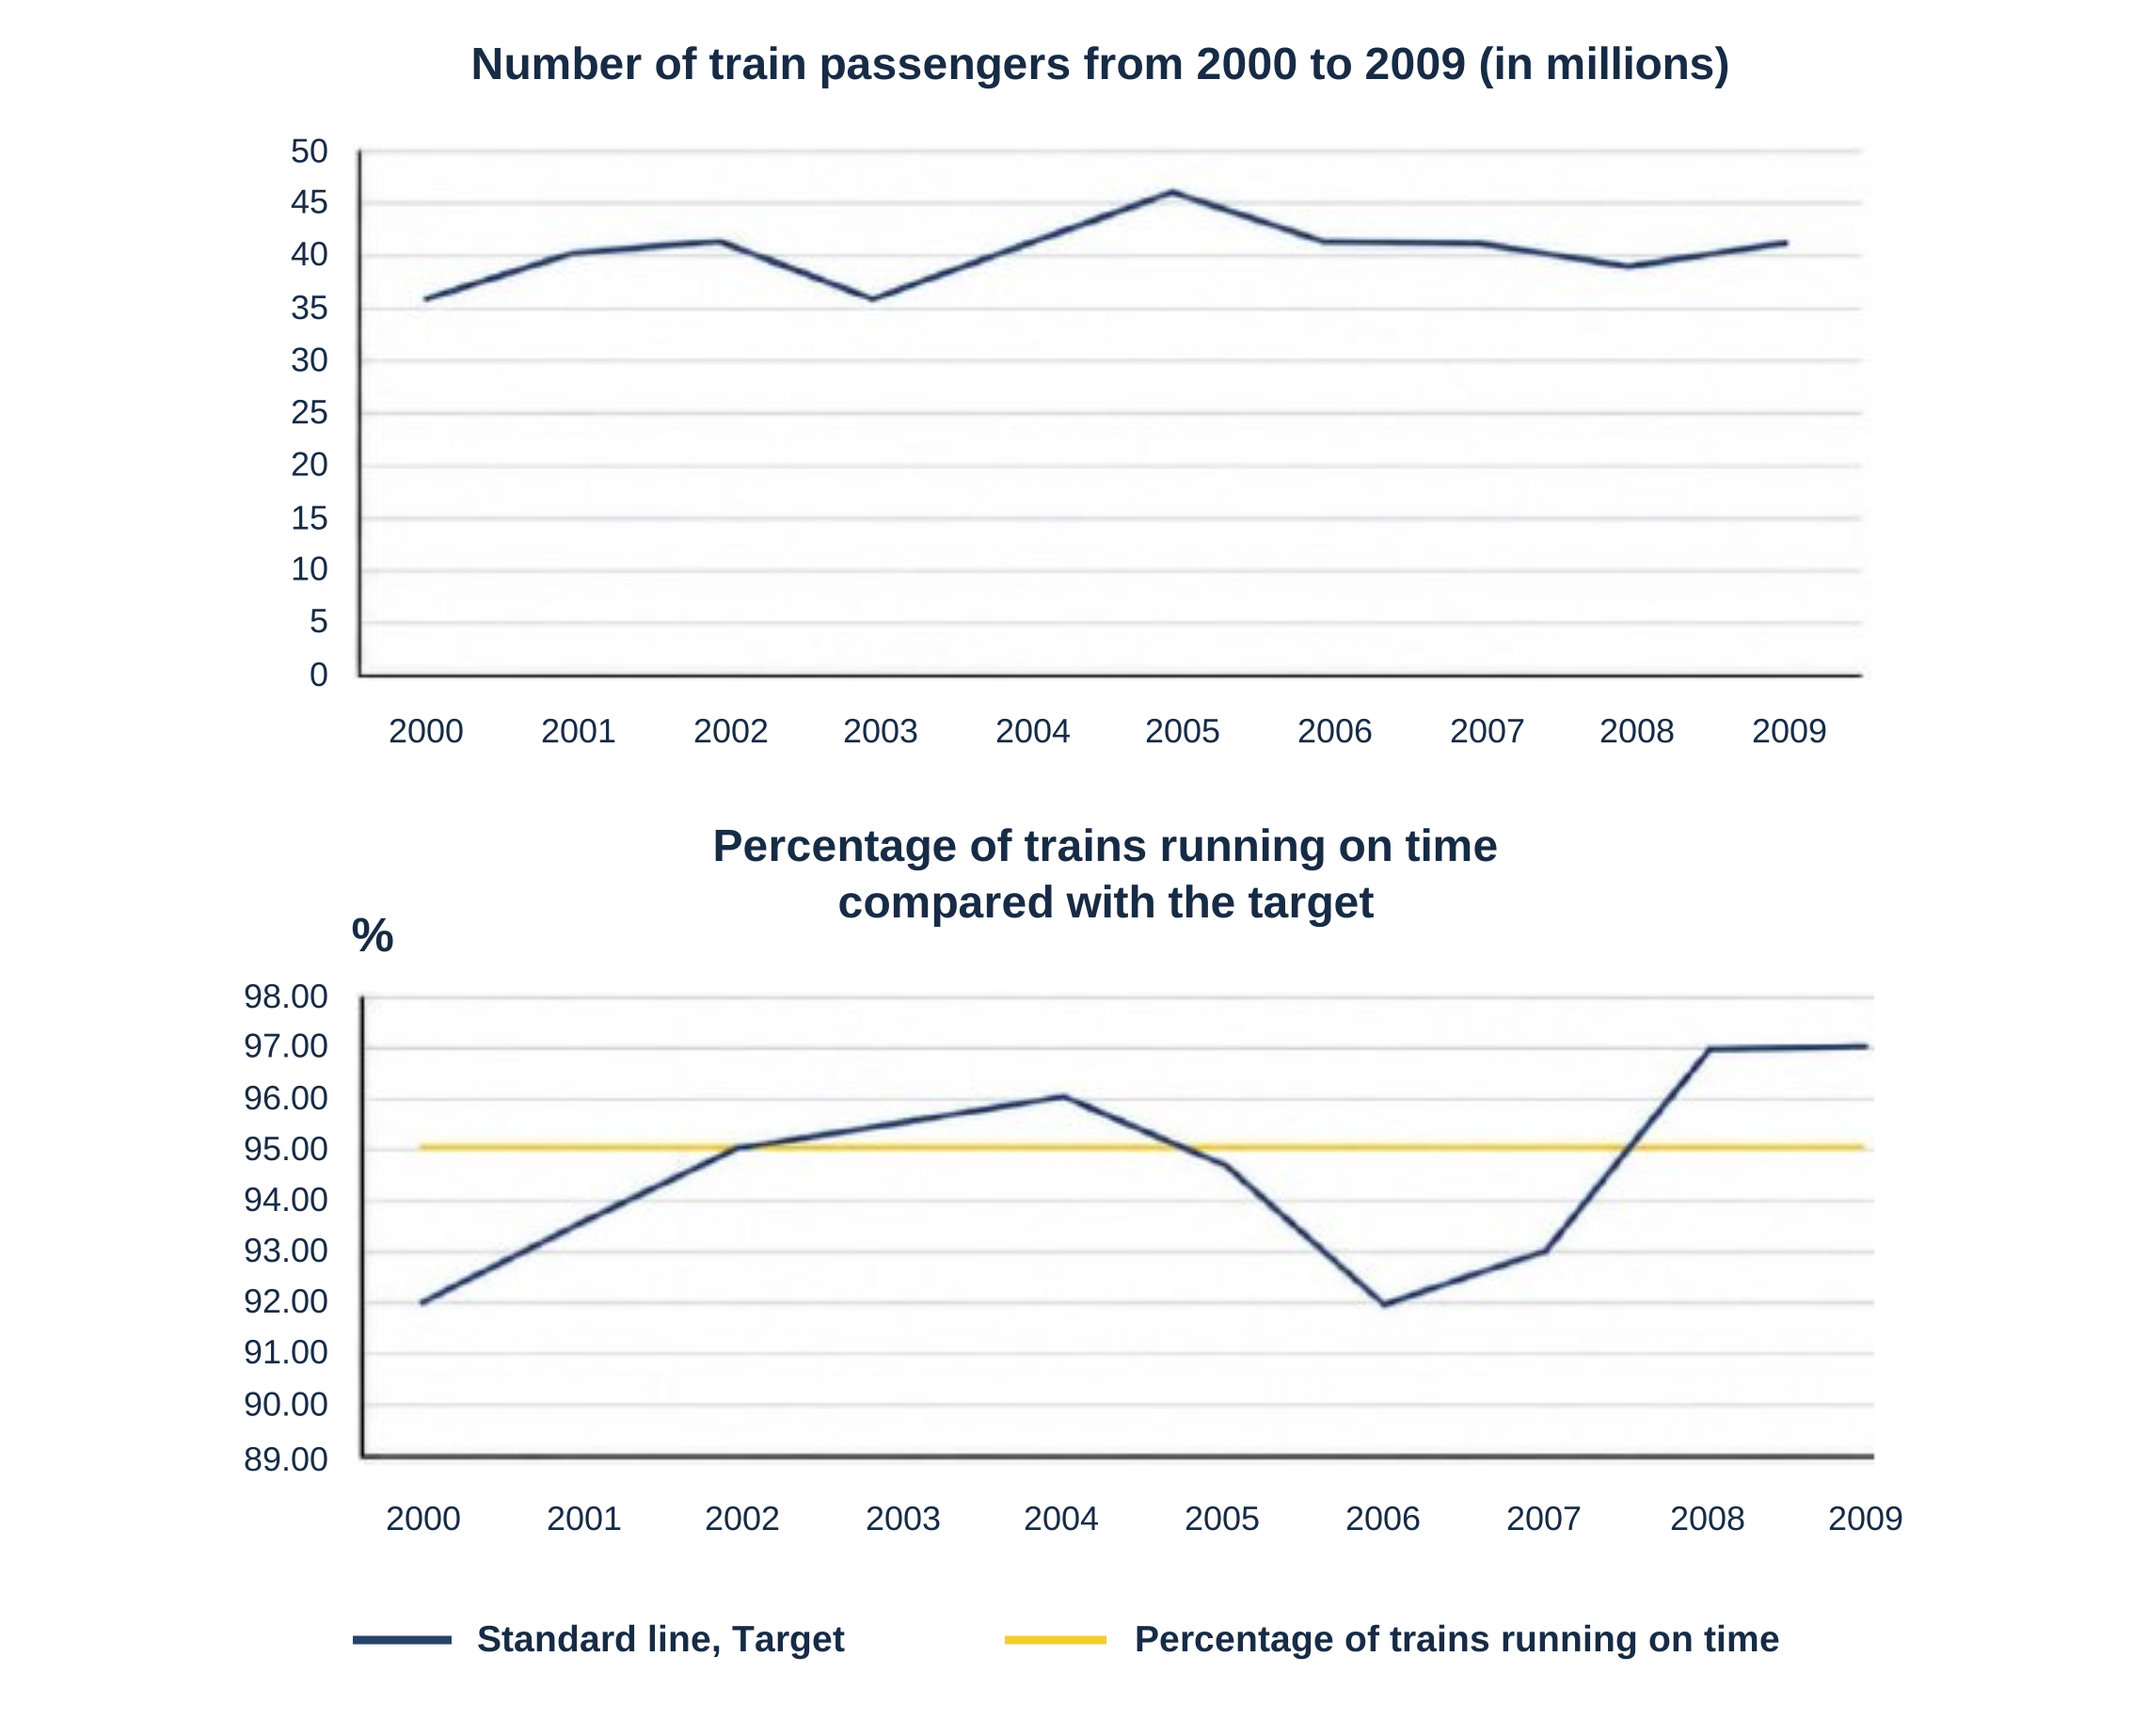
The first graph shows the number of train passengers from 2000 to 2009, while the second compares the percentage of trains that ran on time with the target during the same period.
Summarise the information by selecting and reporting the main features, and make comparisons where relevant.
Write at least 150 words.
Writing Task 2
Academic Writing Task 2
You should spend about 40 minutes on this task.
Some people think that parents should read or tell stories to their children. Others believe that parents do not need to do this, as children can read books or watch TV and movies by themselves.
Discuss both views and give your own opinion.
Give reasons for your answer and include any relevant examples from your own knowledge or experience.
Write at least 250 words.