Writing Task 1
Academic Writing Task 1
You should spend about 20 minutes on this task.
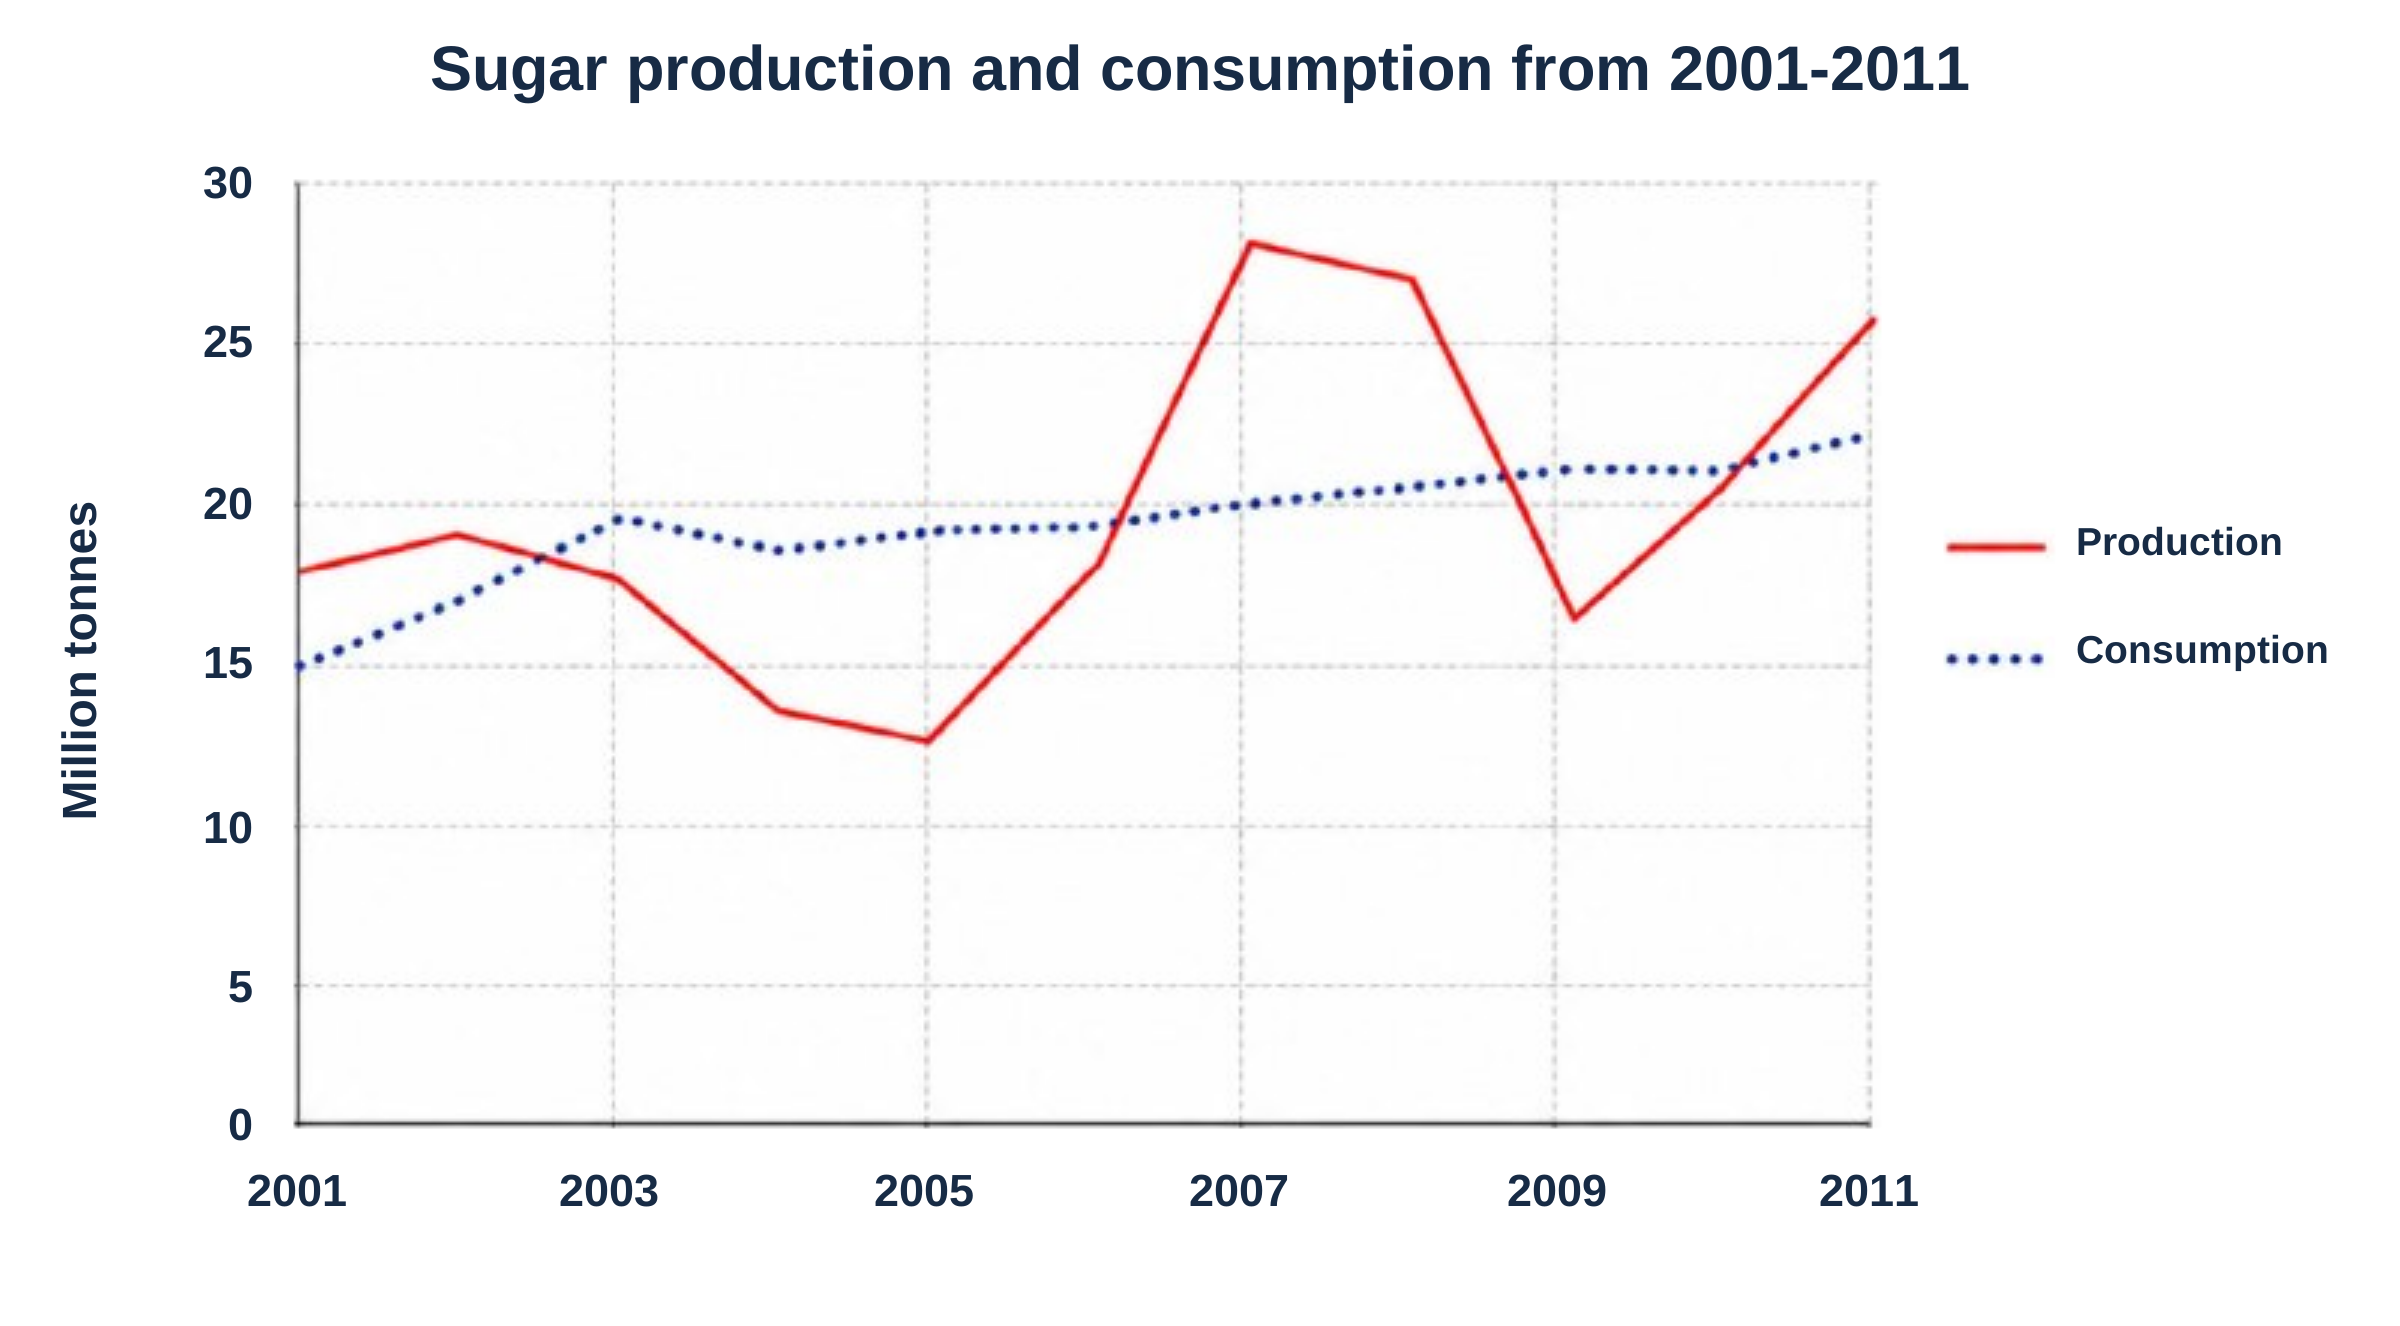
The graph below gives information about sugar production and consumption in India from 2001 to 2011.
Summarise the information by selecting and reporting the main features, and make comparisons where relevant.
Write at least 150 words.
Writing Task 2
Academic Writing Task 2
You should spend about 40 minutes on this task.
Some people believe that the purpose of education is to prepare individuals to be beneficial members of society, while others say that its purpose is to help individuals achieve their personal ambitions.
Discuss both views and give your own opinion.
Give reasons for your answer and include any relevant examples from your own knowledge or experience.
Write at least 250 words.