Writing Task 1
Academic Writing Task 1
You should spend about 20 minutes on this task.
The line graph below shows the percentage of tourists who used different types of transport in a particular country between 1989 and 2009.
Summarise the information by selecting and reporting the main features, and make comparisons where relevant.
Write at least 150 words.
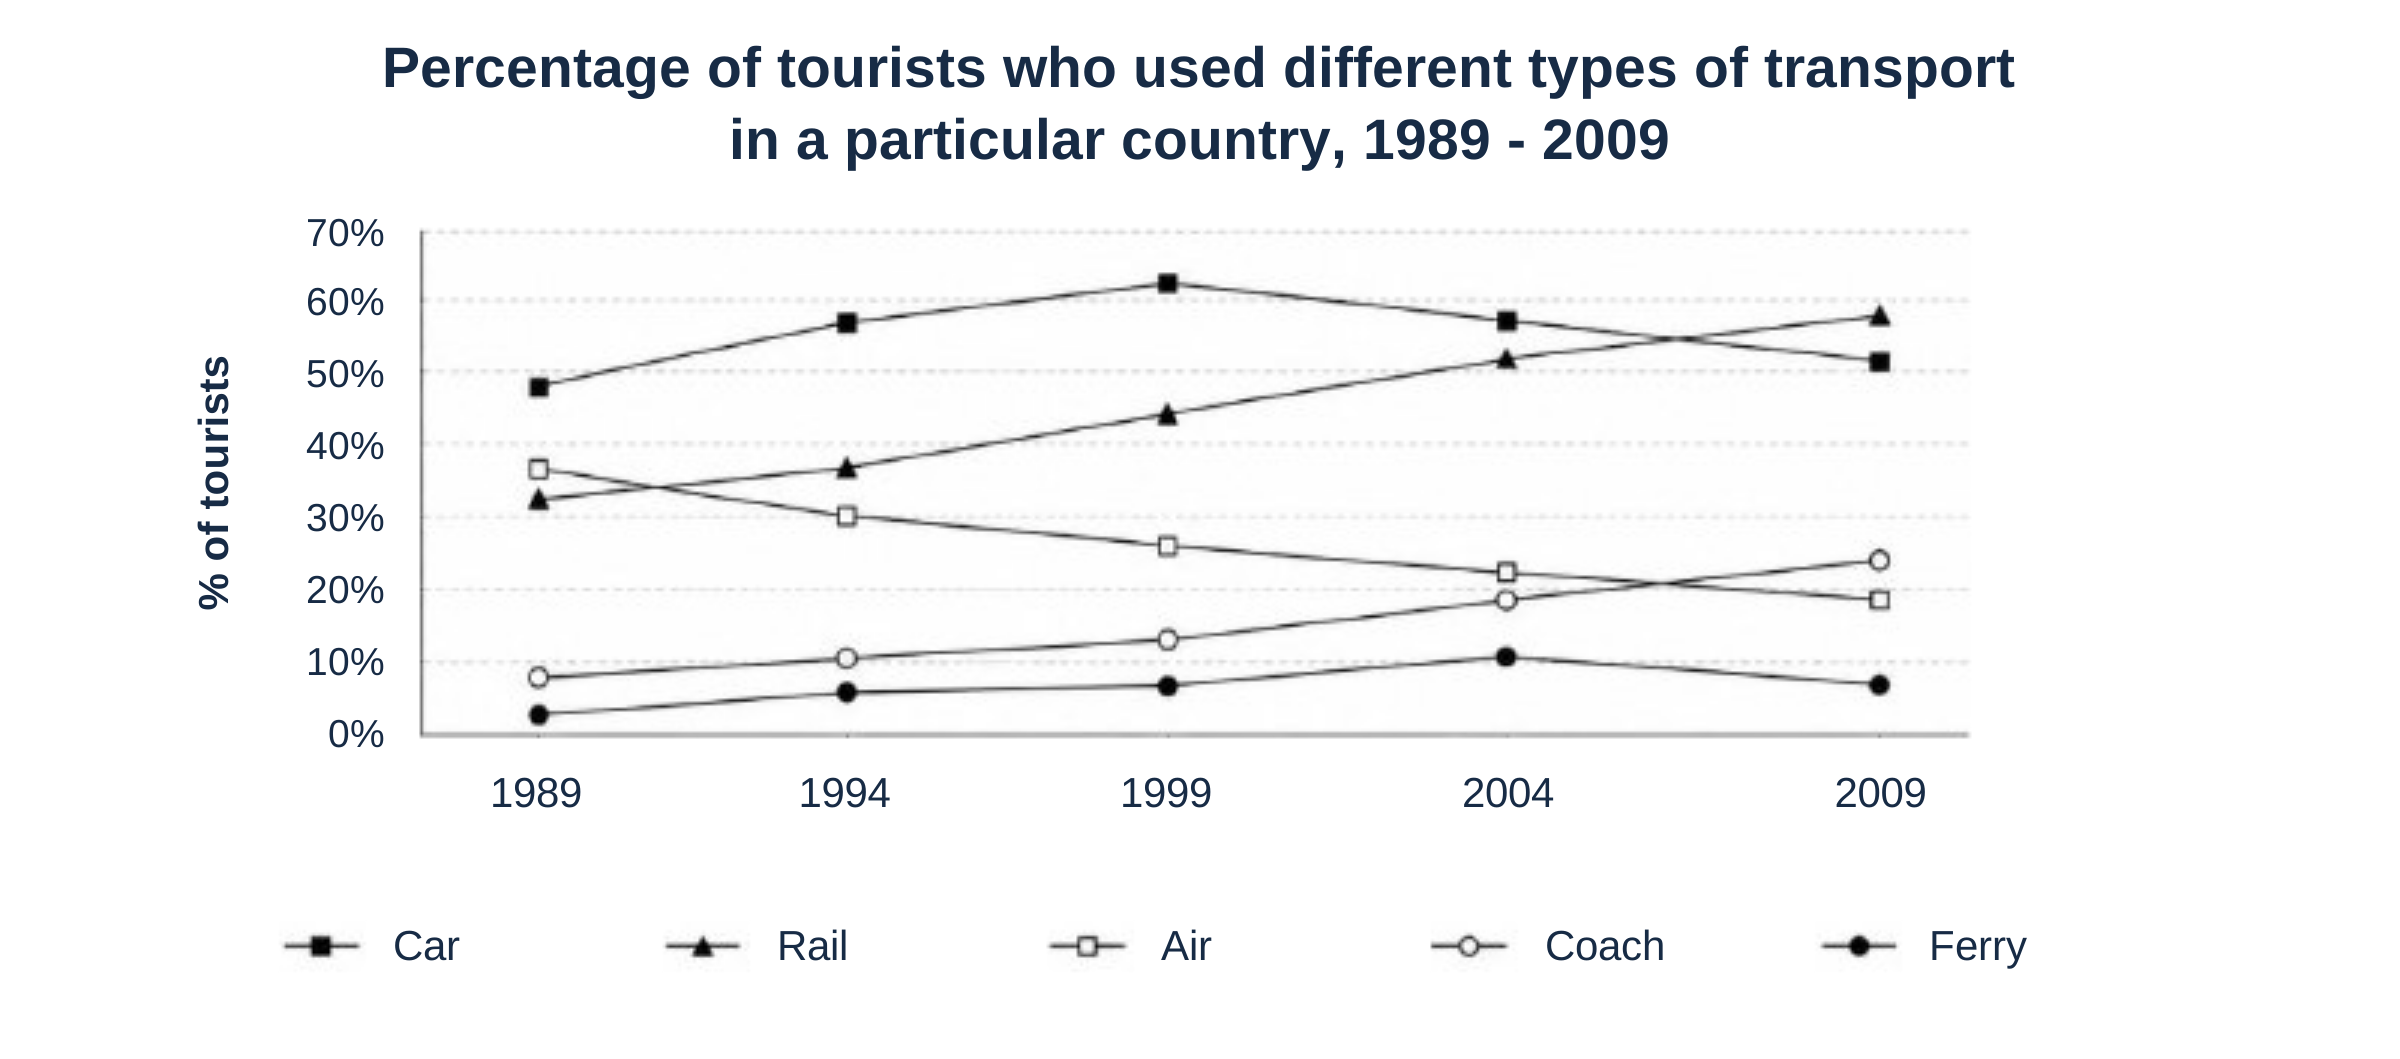
Click the graph to enlarge
Writing Task 2
Academic Writing Task 2
You should spend about 40 minutes on this task.
Parents should encourage their children to spend less time studying and more time doing physical activities.
Do you agree or disagree?
Give reasons for your answer and include any relevant examples from your own knowledge or experience.
Write at least 250 words.
Your answer — Task 1
0 words