Writing Task 1
Academic Writing Task 1
You should spend about 20 minutes on this task.
The graph below shows the number of immigrants to three countries from 1990 to 2001.
Summarise the information by selecting and reporting the main features, and make comparisons where relevant.
Write at least 150 words.
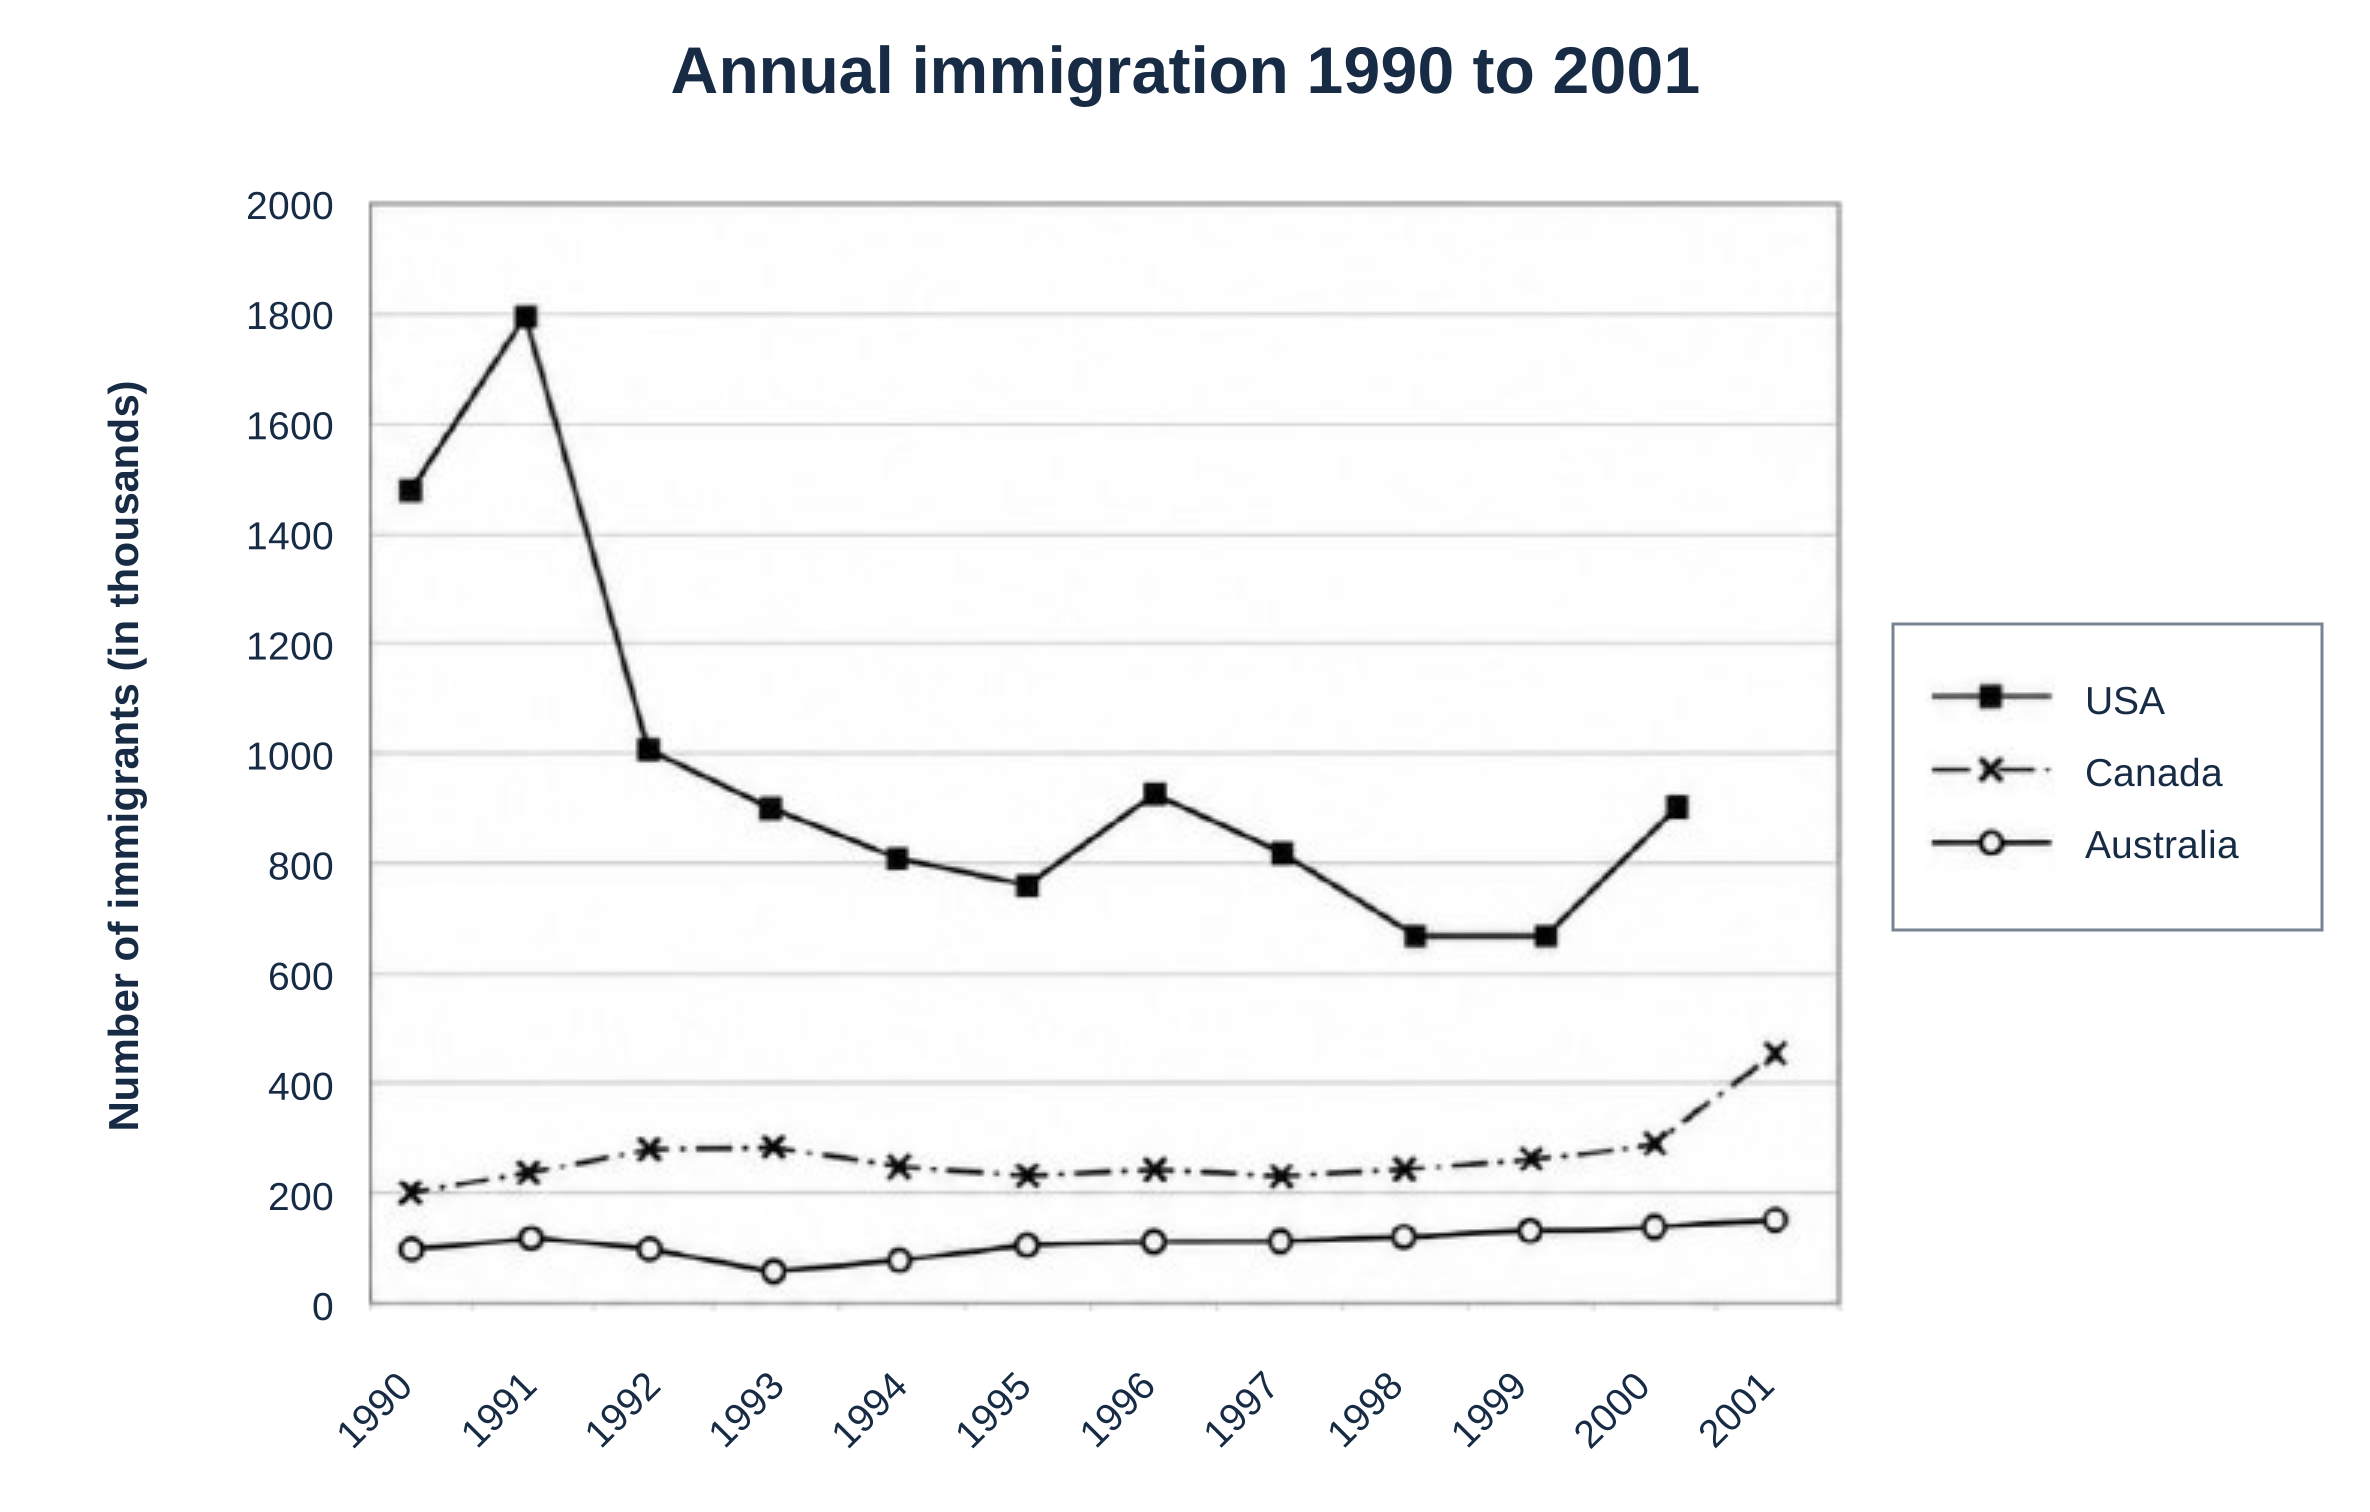
Click the graph to enlarge
Writing Task 2
Academic Writing Task 2
You should spend about 40 minutes on this task.
Some people say that too much attention and too many resources are devoted to the protection of wild animals and birds.
To what extent do you agree or disagree with this opinion?
Give reasons for your answer and include any relevant examples from your own knowledge or experience.
Write at least 250 words.
Your answer — Task 1
0 words