Writing Task 1
Academic Writing Task 1
You should spend about 20 minutes on this task.
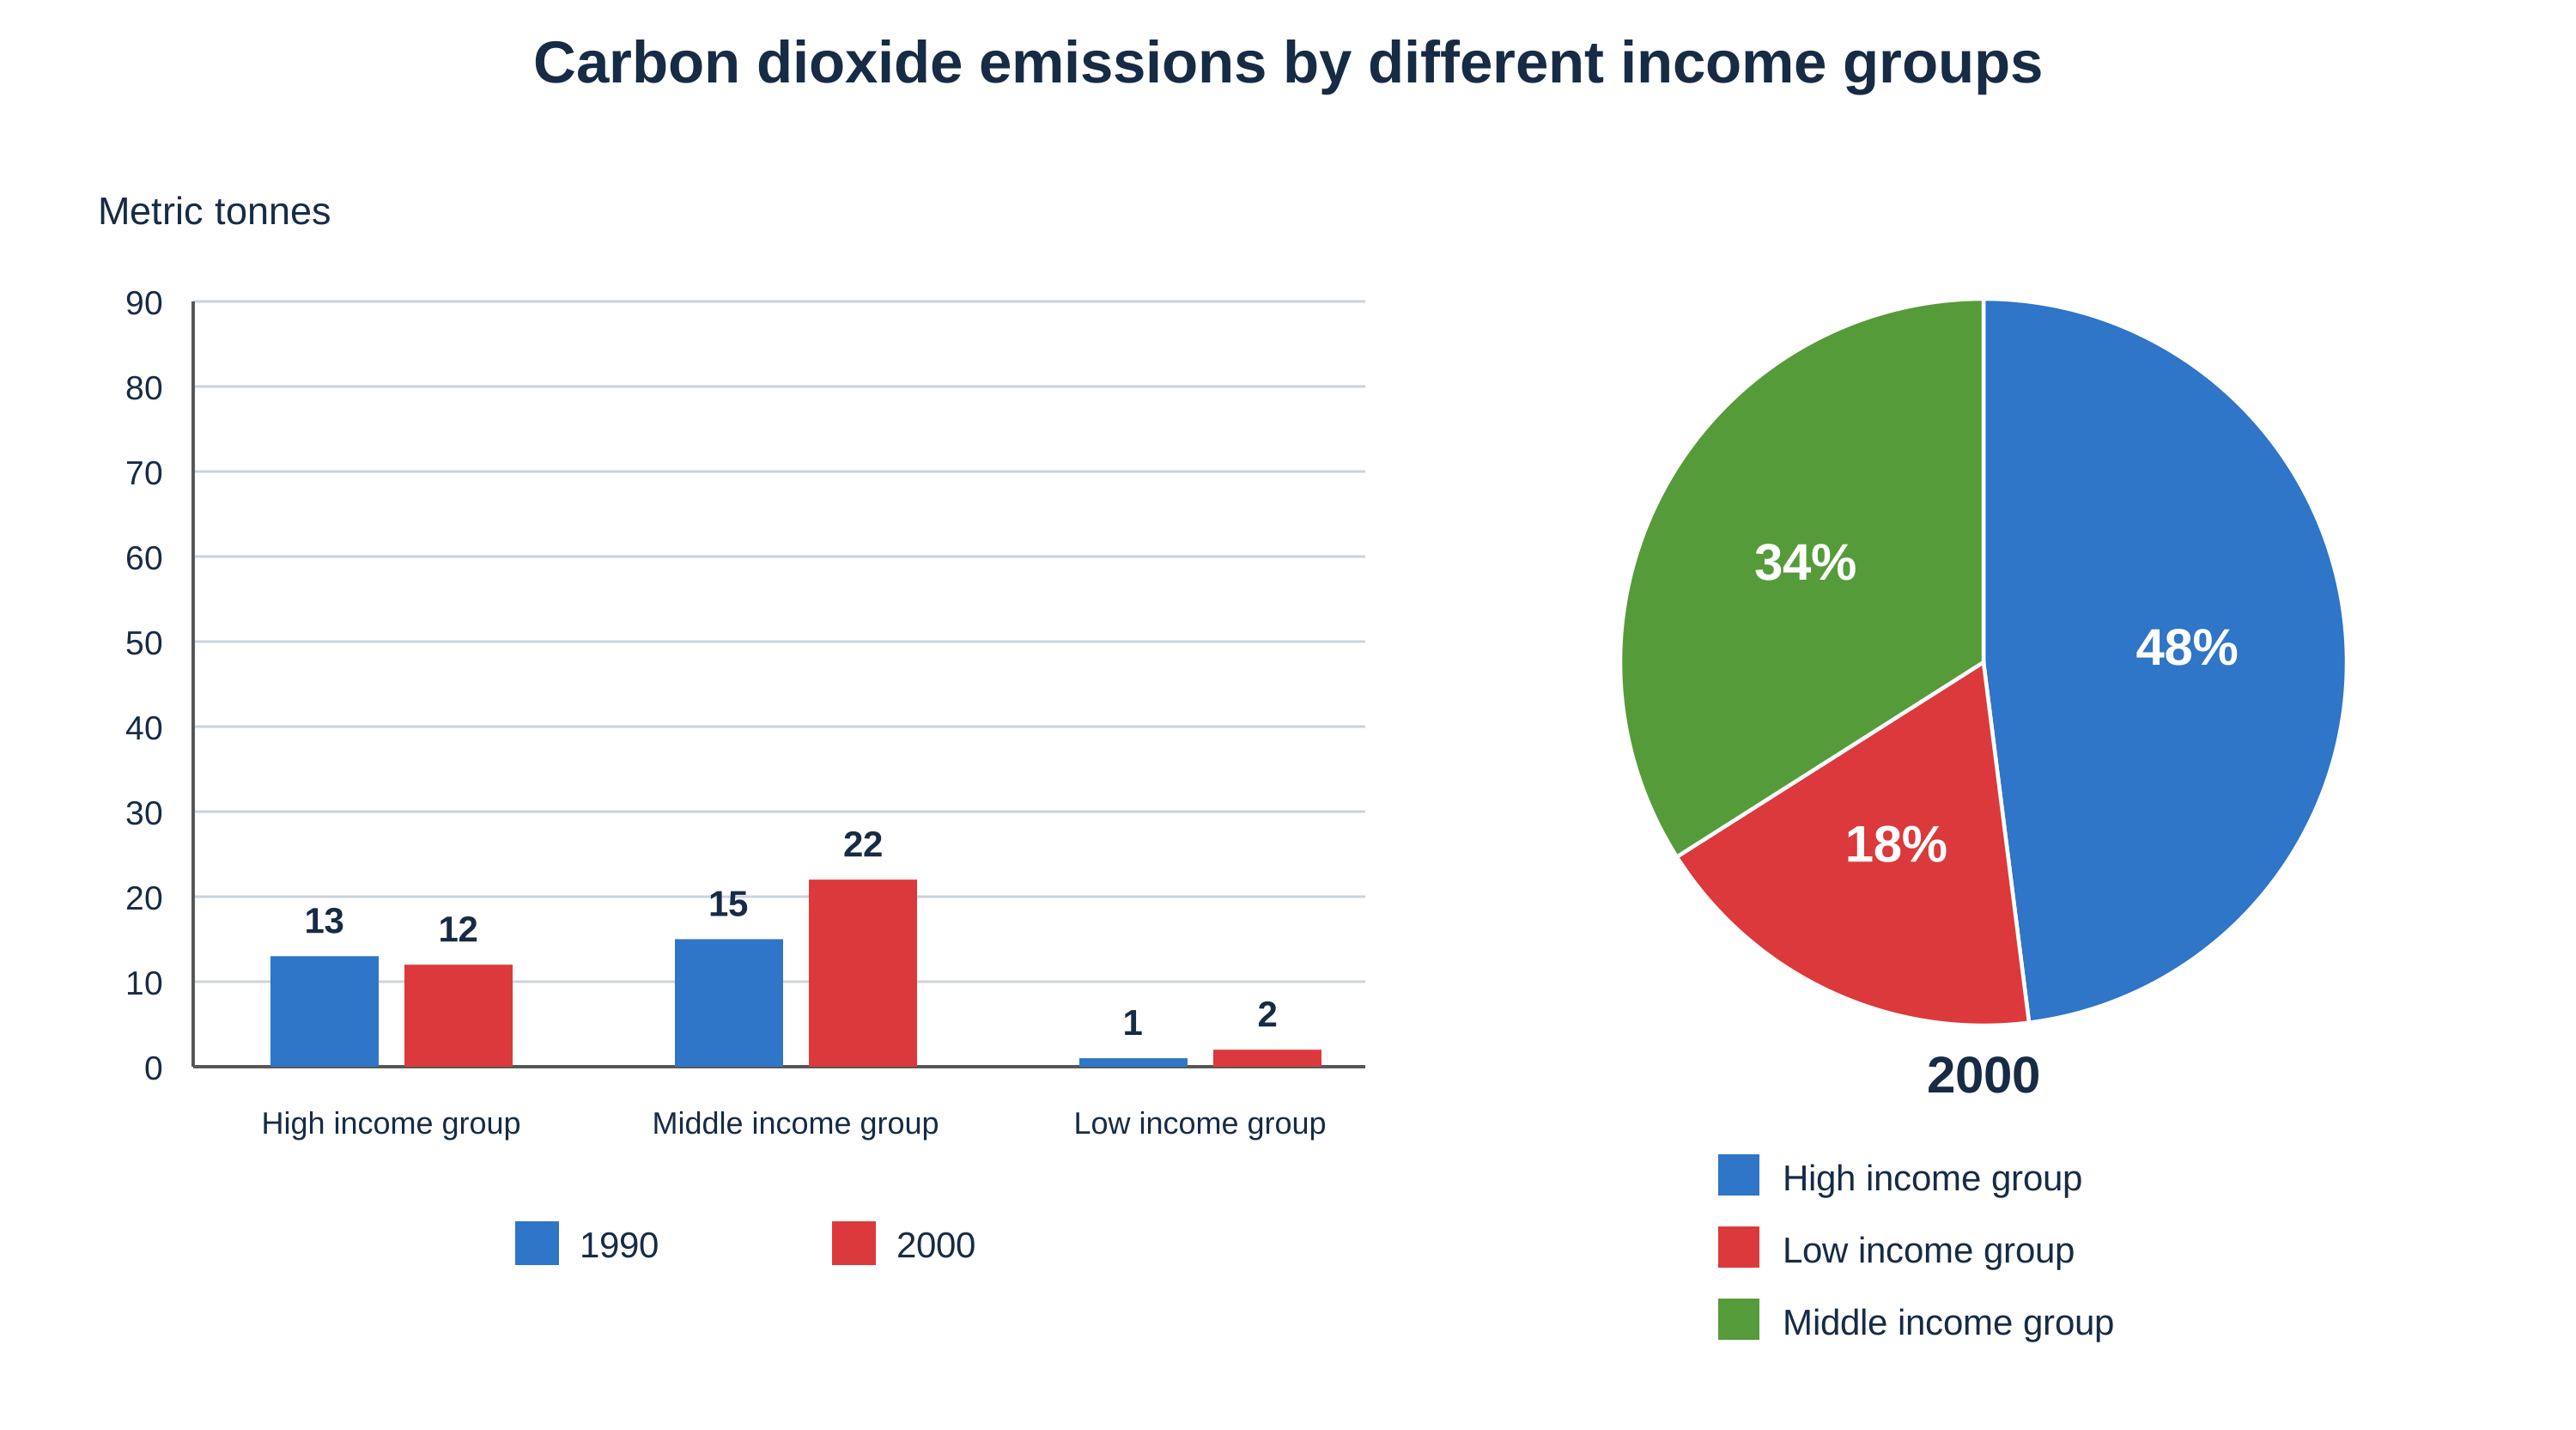
The bar chart and pie chart show the amount of carbon dioxide (CO₂) emitted by three different income groups in 1990 and 2000, and the proportion of the world’s population represented by each income group in 2000.
Summarise the information by selecting and reporting the main features, and make comparisons where relevant.
Write at least 150 words.
Writing Task 2
Academic Writing Task 2
You should spend about 40 minutes on this task.
Some people think that it is good for a country’s culture to import foreign films and TV programmes. Others think that it is better to produce them locally.
Discuss both views and give your own opinion.
Give reasons for your answer and include any relevant examples from your own knowledge or experience.
Write at least 250 words.